Since late June, when Northeastern announced plans to re-open campus, the university has been dedicated to strict guidelines and thorough testing protocols. The administration reduced classroom density, allowed students and faculty to attend and teach classes remotely, switched dining halls to take-out, and banned guests from campus housing.
Students, faculty, and staff must undergo routine self-administered COVID-19 testing and complete wellness check-ins daily. If a community member is exposed to the virus, they must quarantine for fourteen days. If someone tests positive, they must isolate themselves.
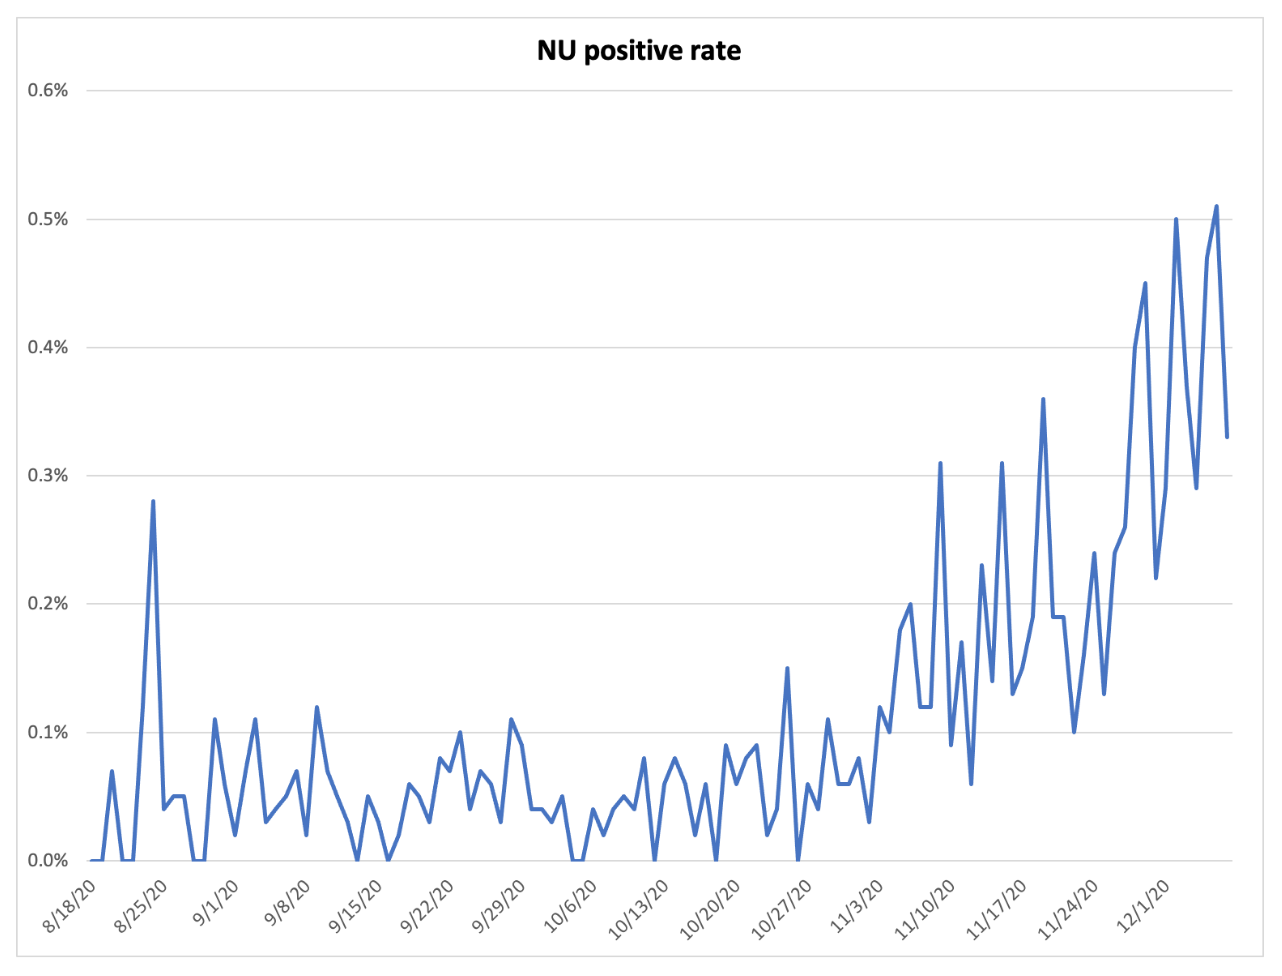
Between August 17 and December 7, the Boston campus’s testing centers administered over 480,000 COVID-19 tests, with an average of about four positives per day. Northeastern’s daily positive rate—the number of positives per total tests—has only exceeded 0.5 percent once, with an average of 0.11 percent.
However, these averages and the statistics on Northeastern’s online testing dashboard are misleading. That is both inappropriate and dangerous.
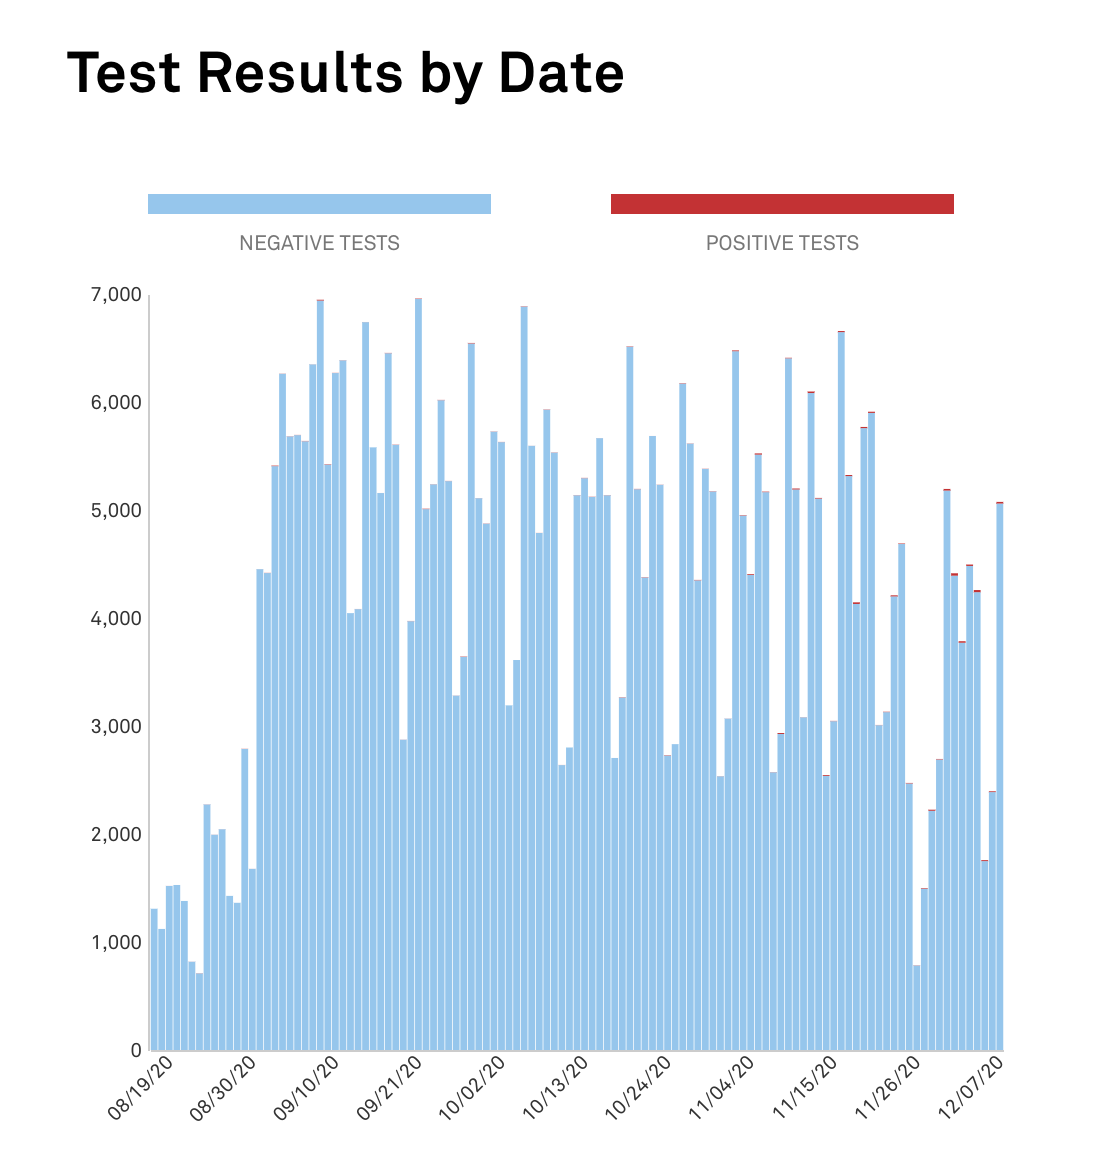
As of December 9, the graph on the dashboard looked like this:
At first glance, the results look phenomenal. The array of blue shows almost no positive tests.
But the graph highlights the wrong data. It shows Northeastern’s remarkable testing capability, not the true spread of COVID-19 on campus. When students are tested every three days, and the center averages over four thousand tests per day, the blue bars will be huge. Looking solely at the graph, the number of positives seems miniscule.
What the graph obscures is the trend in positive tests on campus, and by extension, the current risk level. The number of COVID-19 cases is increasing across the country, with nearly every state seeing an uptick over the last few weeks. The number of cases at Northeastern is following the same trend, albeit on a much smaller scale.
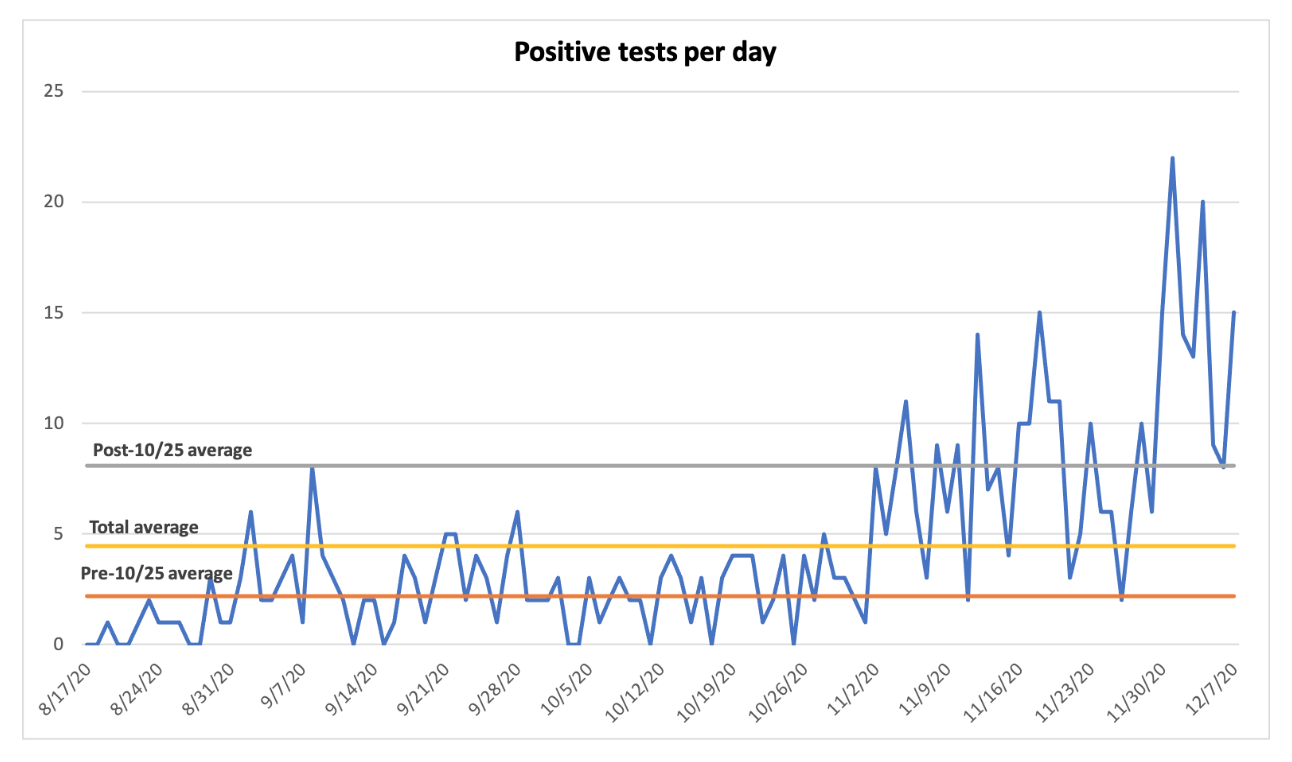
The last day that Northeastern had zero positive tests was October 25—over six weeks ago. Before then, the average was around two positives per day. Since then, it has quadrupled.
The dashboard documented a record number of positive tests (twenty-two) on December 1. Before then, the record was fifteen positives each on November 18 and 30. The university has yet to acknowledge this spike in cases. Even on Thanksgiving, when only about one-fifth of the usual number of tests were completed, there were still positives.
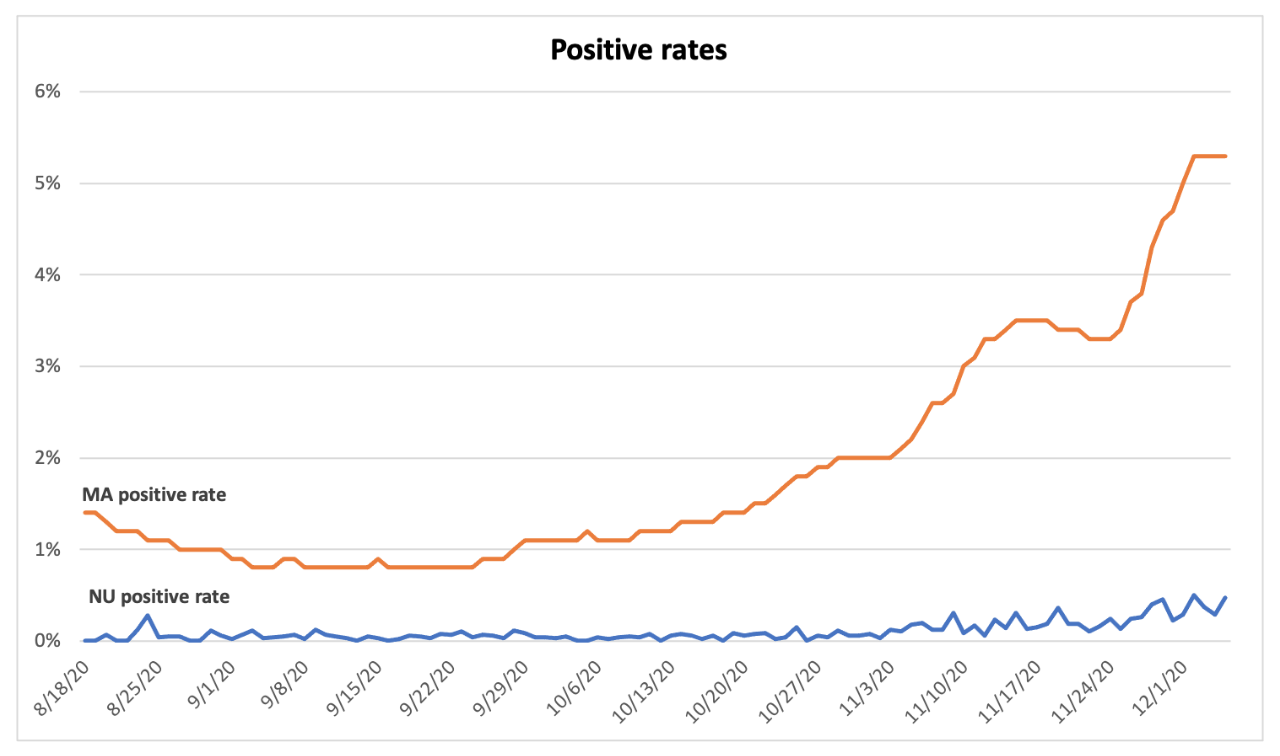
That said, Northeastern’s numbers look good compared to the rest of Massachusetts. The campus positive rate has stayed well below the state’s; until December 8, the testing dashboard juxtaposed the Northeastern and Massachusetts rates to show this.
Positive rates depend on how many tests are administered. Northeastern’s thousands-per-day model of surveillance testing yields a much lower rate than the state as a whole, where people are generally tested only when they are symptomatic. If the university tested only symptomatic people, or tested everyone only once a week, its positive rate would be higher. Michael Armini, Northeastern’s senior vice president for external affairs, confirmed that this comparison issue was the reason the Massachusetts data was removed from the dashboard.
The concerning upward trend of Northeastern’s positive rate is clearer when graphed by itself:
Massachusetts guidelines dictate that people with COVID-19 symptoms or known exposure should be tested. This means that people getting tested are more likely to have the virus. Northeastern, on the other hand, requires that all students in Boston get tested every three days whether or not they’re experiencing symptoms or have been exposed. The vast majority of them have had no symptoms or known contact with the virus.
More testing is absolutely good—anyone who wants or needs it should be able to get it, and everyone would be better off if Northeastern’s capacity could be replicated on a much larger scale. Northeastern’s protocols increase the likelihood of catching asymptomatic people, and isolation guidelines prevent those people from spreading the virus to others.
However, because Northeastern’s data skews toward negatives, the university can mask the true impact of COVID-19 on campus.
The presentation of COVID-19 data is important; misrepresenting the risk level by bragging about the number of tests administered puts the community in danger. It is irresponsible for the university to present data solely in a way that makes them look good. Students and employees deserve to see the true on-campus trends in order to make educated decisions about the risks of being on campus.
If Northeastern truly wants to keep the community safe, they need to present data appropriately; the dashboard must visually emphasize the number of positive tests. A graph that specifically shows the number of positives—like the easily readable one included above—is more helpful to students, faculty, staff, and families seeking information about COVID-19 on campus.
The Huntington News, Northeastern’s independent student newspaper, has funneled the university’s data into their own dashboard, which more clearly represents testing trends. But it shouldn’t be the responsibility of students to keep track of the data; it should be the university’s responsibility to represent data in a way that clearly shows the trends and risk level.
With any luck, vaccines will allow us to return to nearly normal life within the first half of 2021. But until then, keeping everyone safe and slowing the spread of COVID-19 is more important than ever. People rely on institutions and the government to provide them with updated, accurate, and easily understandable data. Northeastern’s dashboard falls short of this responsibility, hindering the community’s ability to make well-informed decisions and putting us all at risk.

