
January 9, 2020: the World Health Organization announces incidents of a mysterious coronavirus-related pneumonia in Wuhan, China.
January 21: the CDC confirms the first case of Coronavirus Disease 2019 (COVID-19) on United States soil.
January 31: the World Health Organization issues a global health emergency.
More than one year after SARS-CoV-II made its first global appearance, the scientific community has no idea where it originated. Theories abound, but there is no consensus.
Did SARS-CoV-II leap from bats to pangolins to humans at a Chinese wet market? If so, then how did the first known patient with COVID-19, who never visited a wet market, get infected? Why was the virus never recovered from animal tissue at the market? Did SARS-CoV-II travel into China on shipments of frozen food? Rutgers University microbiologist Emanuel Goldman says this transmission route is so rare that it is nearly impossible. Did SARS-CoV-II escape from the coronavirus research laboratory in Wuhan that diplomats criticized for improper safety protocols? No one knows.
Scientists know shockingly little about SARS-CoV-II and even less about what worked to stop its spread pre-vaccine.
We Don’t Know if Shutdowns Worked
Simple shutdowns likely had no impact on COVID-19-related deaths. TJ Rodgers, the founding CEO of Cypress Semiconductor Corp., conducted a state-level analysis between quickness to shut down and death rates, finding a negligible relationship. Since deaths are a lagging indicator of infections, it’s plausible that shutdowns didn’t stop infections either.
These findings hold at the international level as well. Larochelambert et al. correlated a variety of possible COVID-19 risk factors with death rates across 160 countries, then clustered similar countries according to their risk factors. They concluded that the magnitude of measures, including lockdowns, used to fight the pandemic were not linked with COVID-19 deaths.
But there is some evidence to the contrary. Leveraging data from Arizona, the CDC shows that COVID-19 cases (not deaths) increased 151 percent after the state government lifted stay-at-home orders. Following reinstatement, cases fell 75 percent. But the CDC doesn’t explain why they only performed this analysis on Arizona and ignored other states that implemented lockdown orders.
We Don’t Know if School Closures Worked
For nine weeks, eleven North Carolina schools opted to fully reopen as part of the state’s ABC Science Collaborative program. Zimmerman et al. examined contact-tracing data from the program and found “extremely limited within-school secondary transmission of SARS-CoV-2.” Another study, Gillespie et al., looked at two independent schools with fully in-person instruction and concluded that people were significantly more likely to contract SARS-CoV-II in the surrounding community than in school.
COVID-19 School Response Dashboard manager Emily Oster reports similar results: a student is more likely to get SARS-CoV-II in their community than in their school.
Yet, COVID-19 cases exploded at one Israeli school within ten days of its reopening. Scientists hypothesize that transmission was so rapid because crowded classrooms and a heatwave forced administrators to make face masks temporarily optional, but there’s no way to be sure.
We Don’t Know if Masks Worked
Nearly every observational study finds that masks make the difference between high and low infection rates in the context of respiratory viruses.
Still, observational studies are just that, observational, and scientists design many in a poor fashion. It’s difficult to deduce whether mask-wearing, distancing, or hand-washing independently reduce SARS-CoV-II spread when most people who do one do all three.
Scientists consider randomized control trials (RCTs) more reliable than observational studies because these trials allow researchers to establish cause–effect relationships. In RCTs, experimenters randomly assign participants to a treatment group or control group, wait a set period, and compare the outcomes of treated and nontreated patients.
Bundgaard et al. conducted a 4,800-person RCT on the effectiveness of masks. After one month, the rate of SARS-CoV-II infection in the mask group was 1.8 percent and the infection rate in the no masks group was 2.1 percent. In other words, masks did not protect their wearer from infection.
However, the study suffers from some major limitations. It didn’t ensure participants in each group actually did or did not wear masks, and it looked only at how well masks prevented their wearer from getting infected, not those around the wearer. This distinction is important because masks may not protect wearers from getting sick, but instead protect people around the wearers.
Stopping COVID-19: A County-Level Analysis
Faced with confounding evidence regarding what worked to impede SARS-CoV-II spread, we analyzed data from over 200 counties across the US and their corresponding infection data. We measured infections as each county’s maximum weekly average percent positive rate throughout 2020 (excluding January through May when testing rates were low). For the rest of this article, “infections” refers to this maximum value.
Second, we gathered data for more than forty different potential COVID-19 risk factors describing each county. We measured risk factors related to people’s movement in each county—like the amount of time spent at home or at recreational facilities—for exactly one week before infections peaked. Since SARS-CoV-II’s median incubation period is four to five days, people’s behavior one week before peak infections is more likely to influence that peak than their behavior at any other time.
Third, we used machine learning to categorize our counties based on our risk factor data, then compared SARS-CoV-II infections between categories. For instance, we categorized counties into a “high” mask-wearing group and a “low” mask-wearing group and checked if there was a difference in spread between them.
Finally, we listed the categorizations that yielded significant differences in SARS-CoV-II spread and checked to see if controlling for other risk factors explained the finding.
Surprise! Staying Home Worked
Our most significant result: staying home reduced SARS-CoV-II spread. Google releases COVID-19 mobility reports that track how much time people spend at home, recreational facilities, and workplaces. When we categorized counties with this data, we saw that people staying home reduced SARS-CoV-II spread, whereas going to recreational facilities or work did the opposite.
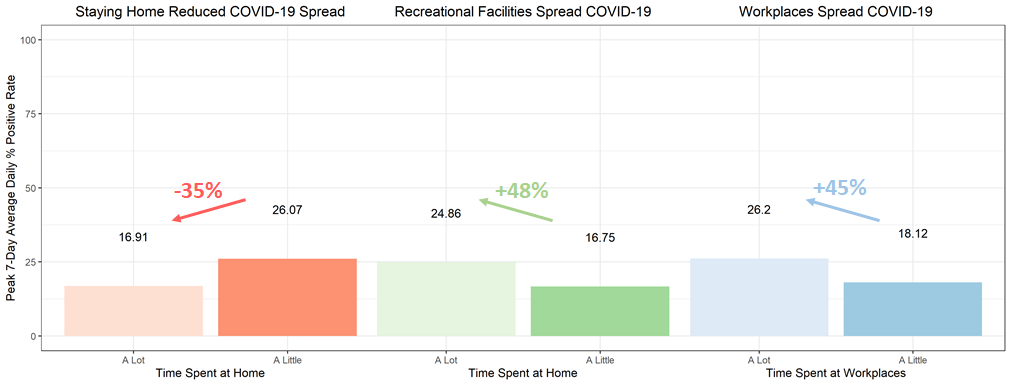
We also identified public transportation as a likely vector of transmission. Using Google’s mobility reports, counties in which people spent a lot of time at public transit stations—and presumably on public transportation—experienced much worse SARS-CoV-II spread than counties where few people used public transportation.
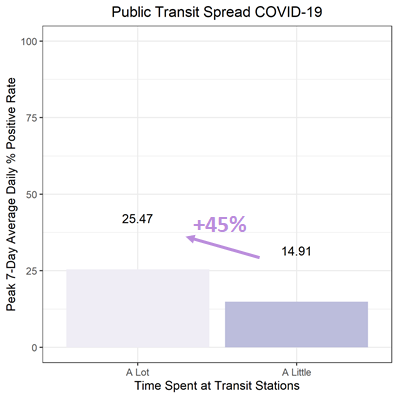
Counter to these findings, previous research has failed to find any link between public transportation and spread. These studies used contact-tracing data to identify COVID-19 clusters or multiple cases of COVID-19 that originated at one event, and found that only a small percentage of clusters in Paris and Japan were linked to public transportation. Still, it’s possible that American public transportation is less sanitary and more densely packed than that of Europe or Asia. It’s also possible that being on public transportation increases one’s risk of contracting SARS-CoV-II by a small but notable amount. So, rather than seeding large clusters at once, it accelerates spread over time.
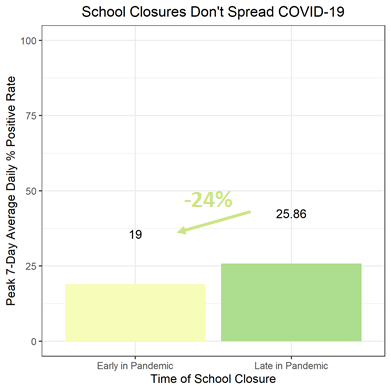
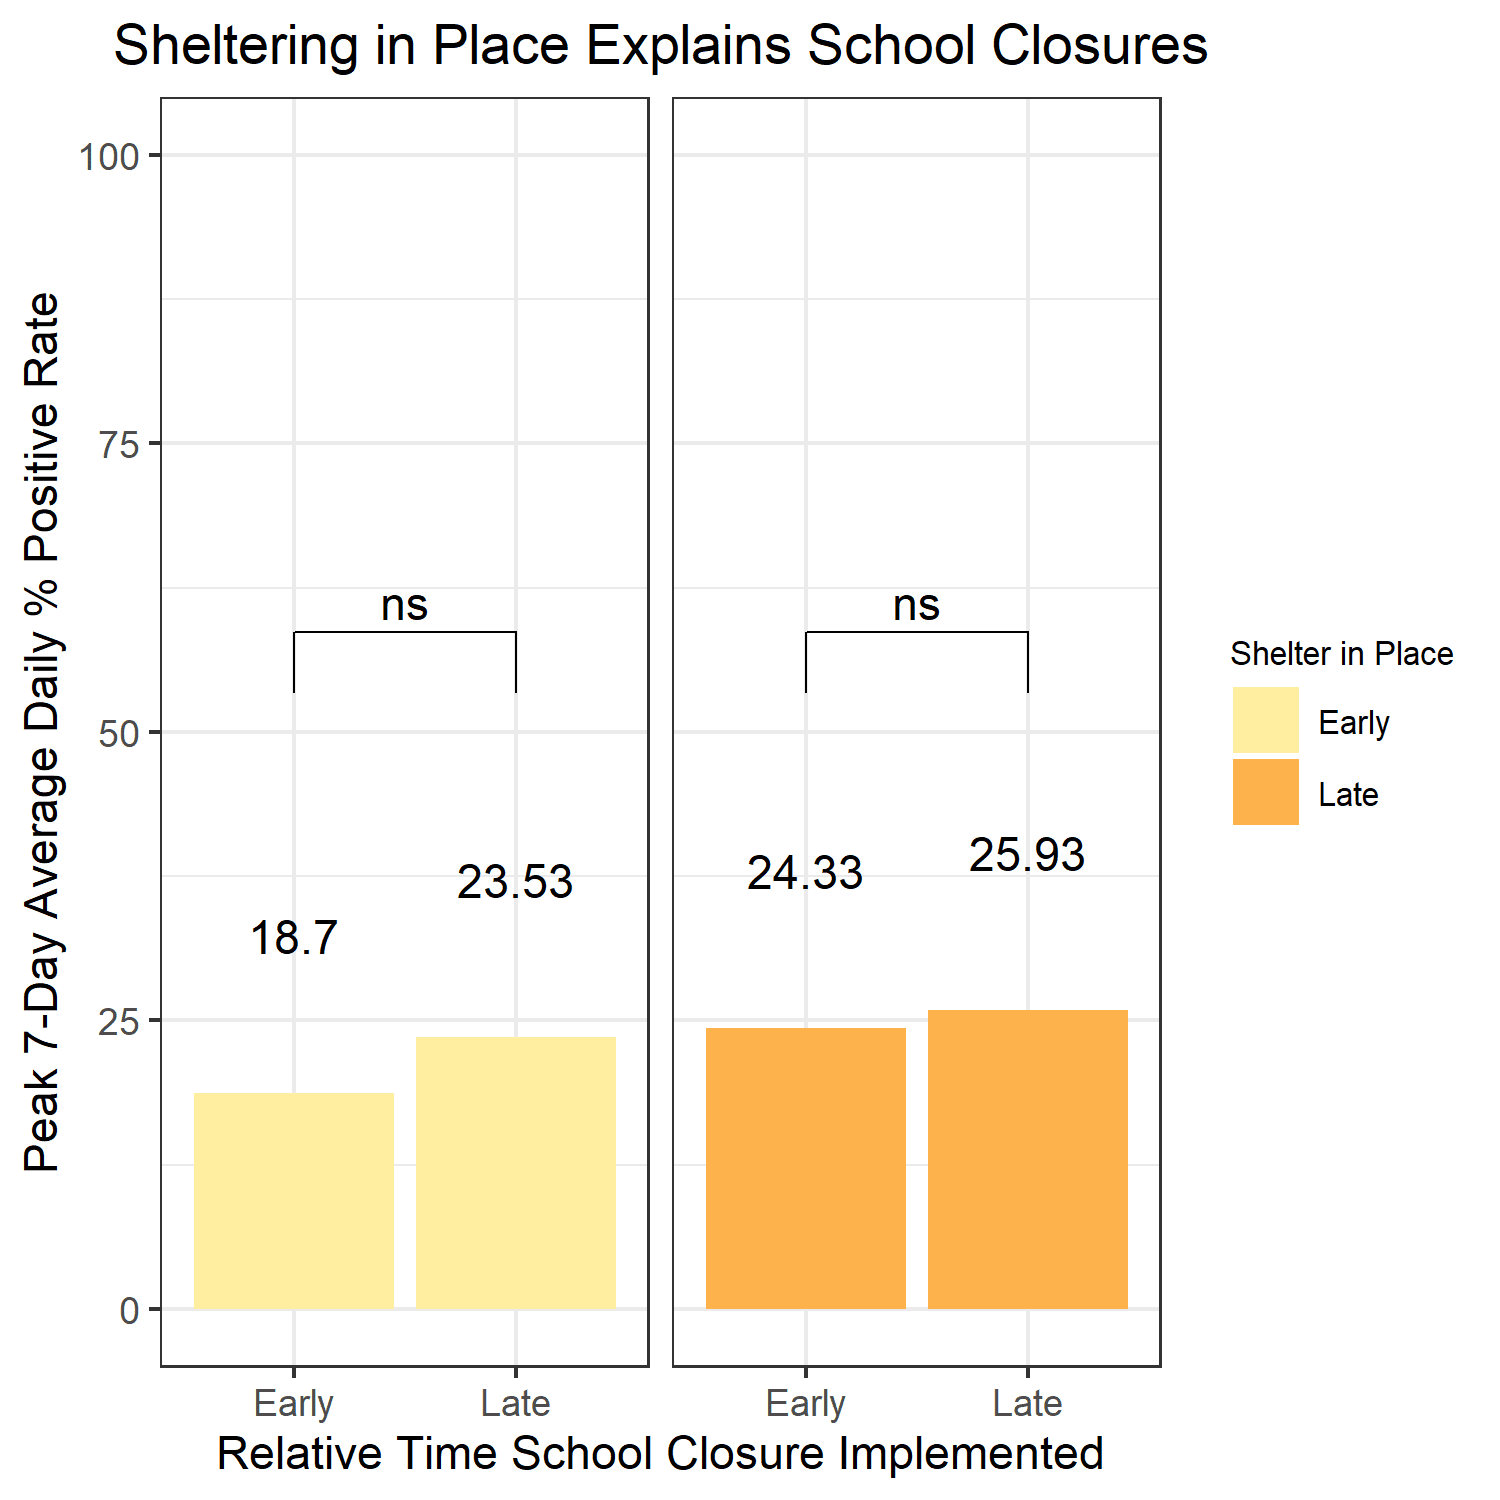
School Closures Probably Didn’t Stop the Spread
While there was a difference in infections between counties that closed schools early in the pandemic compared to those that closed schools late, shelter-in-place orders instituted around the same time entirely explained the difference. These results, coupled with previous literature, suggest that closing schools did not meaningfully impede SARS-CoV-II spread.
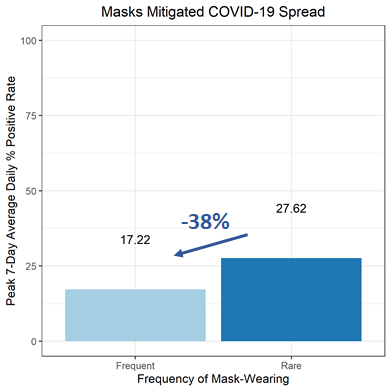
Masks Mitigated Infection
Our findings also suggest masks protect against SARS-CoV-II infection. Counties where many people reported wearing masks experienced fewer infections than counties where people didn’t wear masks often.
Of note, there was minimal variation in our mask-wearing data. Despite a clear majority of every county claiming to wear masks, we still identified masks as a significant influencer of SARS-CoV-II spread, suggesting that masks played a larger role than we could measure. Counties where fewer than 60 percent of people wore masks likely had much more spread than the “low” mask-wearing group.
Takeaways
Our analysis is imperfect. We included only medium- to large-sized counties, and our investigation was observational rather than experimental. Still, our data fills gaps in the literature left by underpowered and contradictory studies.
While existing research suggests lockdowns were meaningless, our data shows that staying home reduced SARS-CoV-II spread. The disparity between their results and ours is probably a result of our more robust analysis. Previous studies assumed that quickness to shut down would be linearly related to COVID-19 deaths (and infections) and that lockdown orders are a proxy for people’s behavior. We didn’t make these assumptions.
We used machine learning to avoid relying on linear regression—of which both Rodgers and Larochelambert et al. are guilty—and we used Google COVID-19 mobility data that directly measures real behavior. On top of this, our county-level analysis controls for population heterogeneities present at the state and international levels.
Our unique analysis supports Zimmerman et al. and Gillespie et al.’s findings that school closures did not significantly impact SARS-CoV-II spread, as well as other observational studies reporting that masks did. In the context of Bundgaard et al.’s randomized control trial, our results imply that masks protect those around the wearer from infection rather than the wearer.
While our study isn’t perfect, if you’re from the future and you’ve been struck so bad with a respiratory pandemic that you seek advice from the age-old pages of the Northeastern University Political Review, you should follow these guidelines:
- Do not leave your home unless necessary. On average, staying home reduced the severity of infections in a community by 35 percent.
- If you do leave your home, avoid public transportation. Our data suggests that although public transportation may not be the source of infection clusters, it could raise your chance of being infected.
- Please, PLEASE, wear a mask. We found that, on average, masks reduce the severity of infections in a community by 37 percent, but the true reduction may be much larger.